When working with datasets, handling missing values becomes a important aspect of data preprocessing. As an example I chose the Titanic dataset, famous for its use in machine learning and data science education. Today, we’re exploring how different methods of imputing missing values can affect the distribution of a dataset, using the ‘Age’ column from the Titanic dataset as our case study.
In the Titanic dataset a significant 20% of the ‘Age’ column values are missing, and the method chosen to fill these gaps can impact the overall data analysis and model performance.
In this post, we’ll explore three different approaches to impute missing age data:
- Filling with the overall mean age.
- Group-based mean, calculated using multiple features.
- K-nearest neighbors (KNN) algorithm.
Imputation Techniques
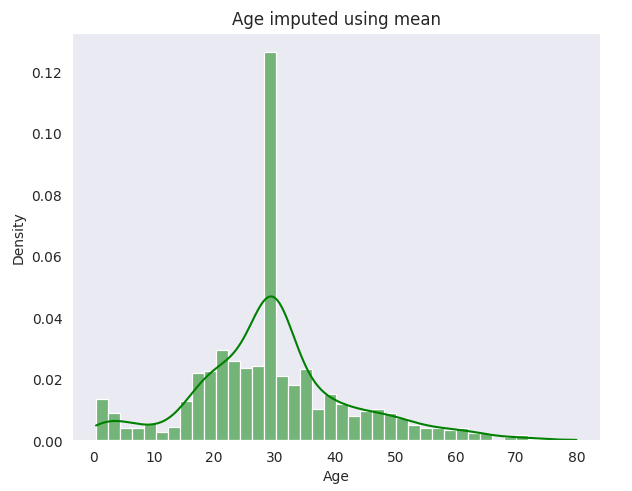
- Overall Mean Age: The simplest approach where all missing values are filled with the mean age of the entire dataset.
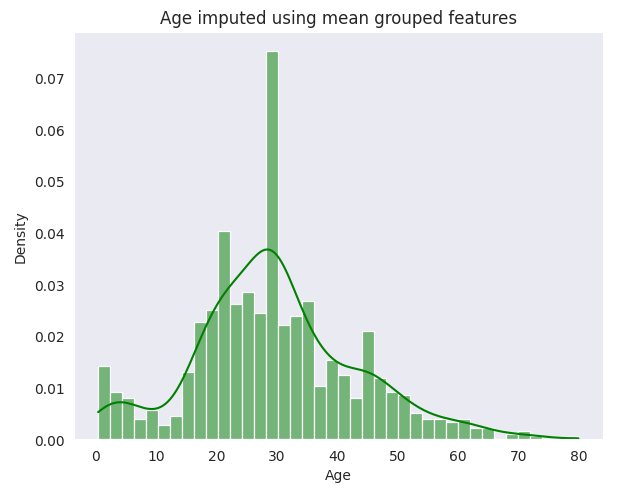
- Group-based Mean: This method involves filling missing ages with the mean age calculated for groups based on ‘Pclass’, ‘SibSp’, ‘Parch’ and ‘Title’. It introduces a more tailored approach, considering socio-economic and gender aspects.
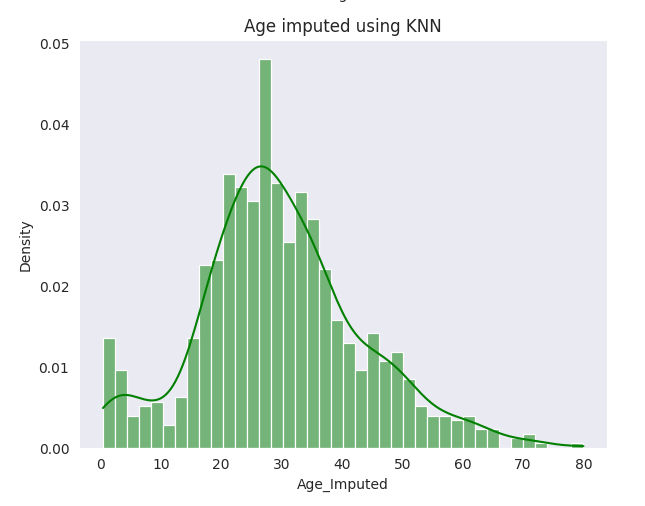
- KNN Imputation: A more sophisticated technique, KNN uses the ‘nearest neighbors’ in the dataset to predict the missing value. It’s based on features like ‘Pclass’, ‘SibSp’, ‘Parch’, ‘Fare’, and the encoded ‘Title’.
Data Preparation
Before diving into the imputation methods, we start by preparing the dataset. This involves creating a ‘Title’ column extracted from the passenger names, which provides a more nuanced categorization, especially useful for age estimation.
Graphical and Numerical Analysis
To visually and quantitatively compare these methods, I used Kernel Density Estimate (KDE) plots and various statistical measures. These analyses provide insights into how each method affects the central tendency and variability of the imputed age data.
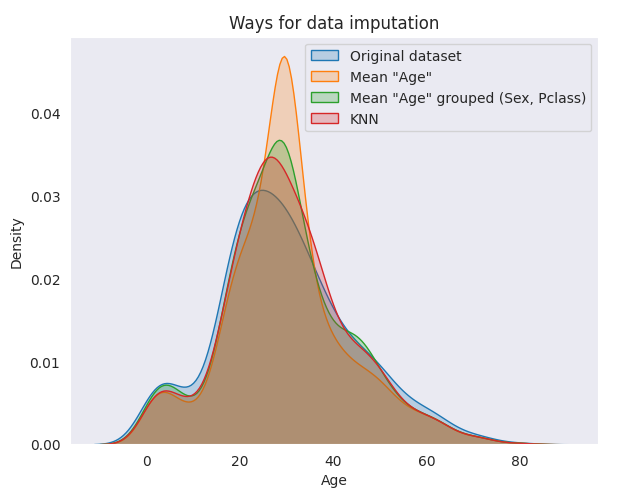
Observations
Central Tendency: KNN preserves the median and mode age of the original dataset, suggesting effectiveness in maintaining the distribution’s shape.
Variability: The simple mean imputation method reduces variance, indicating a potential loss of variability. In contrast, group-based mean and KNN better preserve the original data’s variance and standard deviation.
Case Study: The Title ‘Master’
An interesting observation was made for the title ‘Master,’ typically assigned to young boys. While group-based mean and KNN generally performed well, an anomaly was detected in PassengerId 160’s imputed age using KNN. This discrepancy highlights the influence of a passenger’s nearest neighbors and other features (like high ‘SibSp’ and ‘Fare’) in the KNN method, leading to unusual imputed values in specific cases. Conclusion
While KNN appears effective in terms of variability and maintaining the data’s original distribution, it doesn’t guarantee the accuracy of the imputed values. This method’s effectiveness can be further validated through cross-validation or by reviewing imputed data in the context of other features. For instance, ensuring that individuals with the title ‘Mrs’ are imputed with ages indicating adulthood, and those with ‘Master’ reflect childhood ages.
In conclusion, each imputation method has its strengths and considerations. The choice largely depends on the specific data context, the importance of preserving data variability, and the computational resources at hand.
The Takeaway
Imputation is not just a technical step; it’s a methodological choice that can influence our entire analysis. The group-based mean imputation method stands out for preserving the dataset’s integrity, leading to more accurate and meaningful insights.
By considering the nuances of our data and choosing our imputation methods wisely, we maintain the fidelity of the original information. As we’ve seen, the method of filling missing values can significantly influence data distribution, which in turn affects the conclusions we draw from our analysis.